
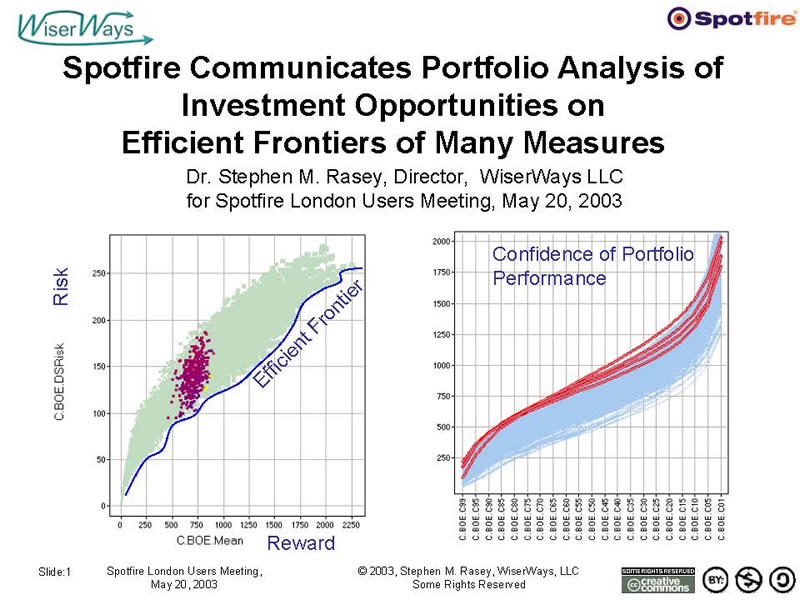
Spotfire Communicates Portfolio Analysis of Investment Opportunities on Efficient Frontiers of Many Measures
This London Spotfire conference presentation is also available in pdf format
Definitions
- Portfolio
- A collection of investments all owned by the same individual or organization .
- Efficient Portfolio
- A portfolio that provides the greatest expected return for a given level of risk , or equivalently, the lowest risk for a given expected return . also called optimal portfolio.
- Efficient Frontier
- The line on a risk-reward graph comprised of all efficient portfolios .
(Source: http://www.investorwords.com)
Portfolio Analysis
A search for Efficient candidate Portfolios from a collection of potential Investment Opportunities.
Acceptable Candidate Portfolios must satisfy Investors Requirements:
Operational – Physically doable
(rig avail, lead time, partners, Working Interest availability)
Political – (BU Capex avail, Maximum $ exposure)
Resource – Budget, People
Performance – Resources found, Production & Earnings Goals, Minimum acceptable results.
Investment Opportunities
Projects where you have an opportunity to invest capital with estimated, but uncertain, profitable returns in the future.
Example here: Exploration Projects
Types of Projects available to fund in this example
Data Base Schema (Projects)
Use the Access Database to prepare Queries for Spotfire
Use the Access Database to prepare Queries for Spotfire
F1D2 – Choose Canned Queries to send to Spotfire
View the Project Metrics and Flows.
S1D1 Query: Project Scalers with Flow Data oriented with Line Items in Columns, Years in rows.
ROR vs NPV color :Env Size:Prob
NPV vs MMBOE
If Success Cash Flow After Tax by year
MMBOE vs ProbGeo
Building a Candidate Portfolio
WiserWays MultiField Confidence Curve Calculator
The version used here can handle
a 200 Project inventory,
Up to 50 funded at any one portfolio
Up to 3 discrete working interest per project
Customized weighted project selection based upon good heuristics.
Each trace calculates has up to 50 Portfolio points.
Each Portfolio point has two confidence curves at isotiles (every 5%) for MMBOE and NPV written to the database.
Process time: 4 seconds per trace including writing to the Database. -- 10 Portfolios per second. (2.4Ghz Pentium IV)
Confidence Curves calculated directly without simulation
Available for sale from WiserWays.
View the Portfolio Confidence Curves and Project Funding.
T1D5 Query: Confidence Curves (MMBOE, NPV) and Funding level Each Project ( Wk.Int.) by Trace Sequence Number
MMBOE Risk Reward (Scatter Plot) Trace 602
NPV Risk Reward (Scatter Plot), Trace 602
NPV Risk Reward, Trace 602, with Details of Project WI
NPV Prob by Cumul Capex Trace 602
MMBOE Prob by Cumul Capex
NPV Risk Reward -Trace 616
MMBOE Confidence Curve - Profile Chart - Trace 616
NPV Confidence Curve - Profile Chart - Trace 616
Heat Map Trace 616
You can use any measure of risk
Efficient Frontiers can also
compare trade-offs between conflicting goals
4 Panel View: 400 MM Capex
DS NPV - Color by WI of 1 Project (386)
DS NPV - Color by WI of 1 Project (386)
Heat Map
View the Portfolio Confidence Curves and Portfolio Flow Data (Production, Devel Capex, CFAT, NIAT, CapEmpl) on a Risked Basis
T1F6 Query: Confidence Curves (MMBOE, NPV) and Portfolio Flow data (Years 2003 through 2012)
Case Study: Select Portfolios using
Capex, Cash Flow, Return on Capital Employed (ROCE), and Efficient Frontier constraints.
Looking at the Cash Flow Profiles, we decide $750 MM in negative Cash Flow is the most we can stand in any year.
We choose the ¼ closest to the efficient frontier of the NPV – Downside Risk plot.
Most of those selected are on the efficient frontier of the Reserves DS Risk Plot.
Next we inspect the NPV Confidence Curves.
Now we inspect ROCE for year 2007 against NPV.
Looking at ROCE by year, we see that for efficient frontier NPV portfolios, we have to give up the highest ROCE in 2005, 2006
Whittle away the worst ROCE’s for each year
Now down to 24 marked portfolos (Set r05)
We now ask, what if we need 2006 ROCE > 10%, what do we give up?
Of the ten portfolios left,
there are 6 different “traces” or Portfolio Builds.
Use the Spotfire Heat Map to determine
which Projects are funded in some or most Portfolios
and see which Projects are never funded.
The Projects, and how many times selected in the marked portfolios and at what average working interest.
WiserWays-Spotfire Portfolio Analysis Process
Define the population of potential Projects to fund
Define a set of Strategies for funding candidate portfolios.
Use an automated process to generate thousands of candidate portfoilos according to the different strategies.
Load the candidate Portfolios into Spotfire
Apply/change constraints by sliding Spotfire query devices.
Select many good portfolios that are close to the Efficient Frontiers of many different measures.
Find the projects most often funded in these good portfolios.
If happy with plan, Fund these projects, Execute Plan
Change and Negotiate Goals.
Refine Strategies.
Comparison of Analysis Methods
Spotfire Sheds Light on a Complicated Problem
- Woolsey’s 1 st Law
- “A Manager would rather live with a problem he cannot solve than accept a solution he does not understand.”
- Woolsey’s 2 nd Law
- “A Manager does not want, and will not pay for, an OPTIMUM solution. He wants to be better off now, as quickly and as cheaply as possible.
WiserWays Portfolio Calculator and Analyzer
By making VISIBLE the potential funding opportunities,
DECISION MAKERS can see available alternatives and the degree of difference (or equivalence) between them.
You can change your constraints in the conference room for real-time turnaround.
Understandable.
Quick. Easy. Inexpensive.
Thanks to
Spotfire
For the opportunity to speak here and for the work we have done together since 2001.
David Bailey, Spotfire
Joe Taylor, Spotfire (Houston)
For helping me debug the Access-Spotfire interaction.
Dr. Ian Learch (Prof. U. of S. Carolina)
Who in 1997 triggered my insight in how to develop the WiserWays Multifield Confidence Curve Portfolio Calculator.
And Thank You for your attention.